Your Party Pro Manager Dashboard gives you a real-time snapshot of your business activity — including upcoming events, booking performance, and key daily tasks that need attention.
It’s designed to help you stay on top of what matters most at a glance, without having to dig through different sections of your account.
Dashboard Overview
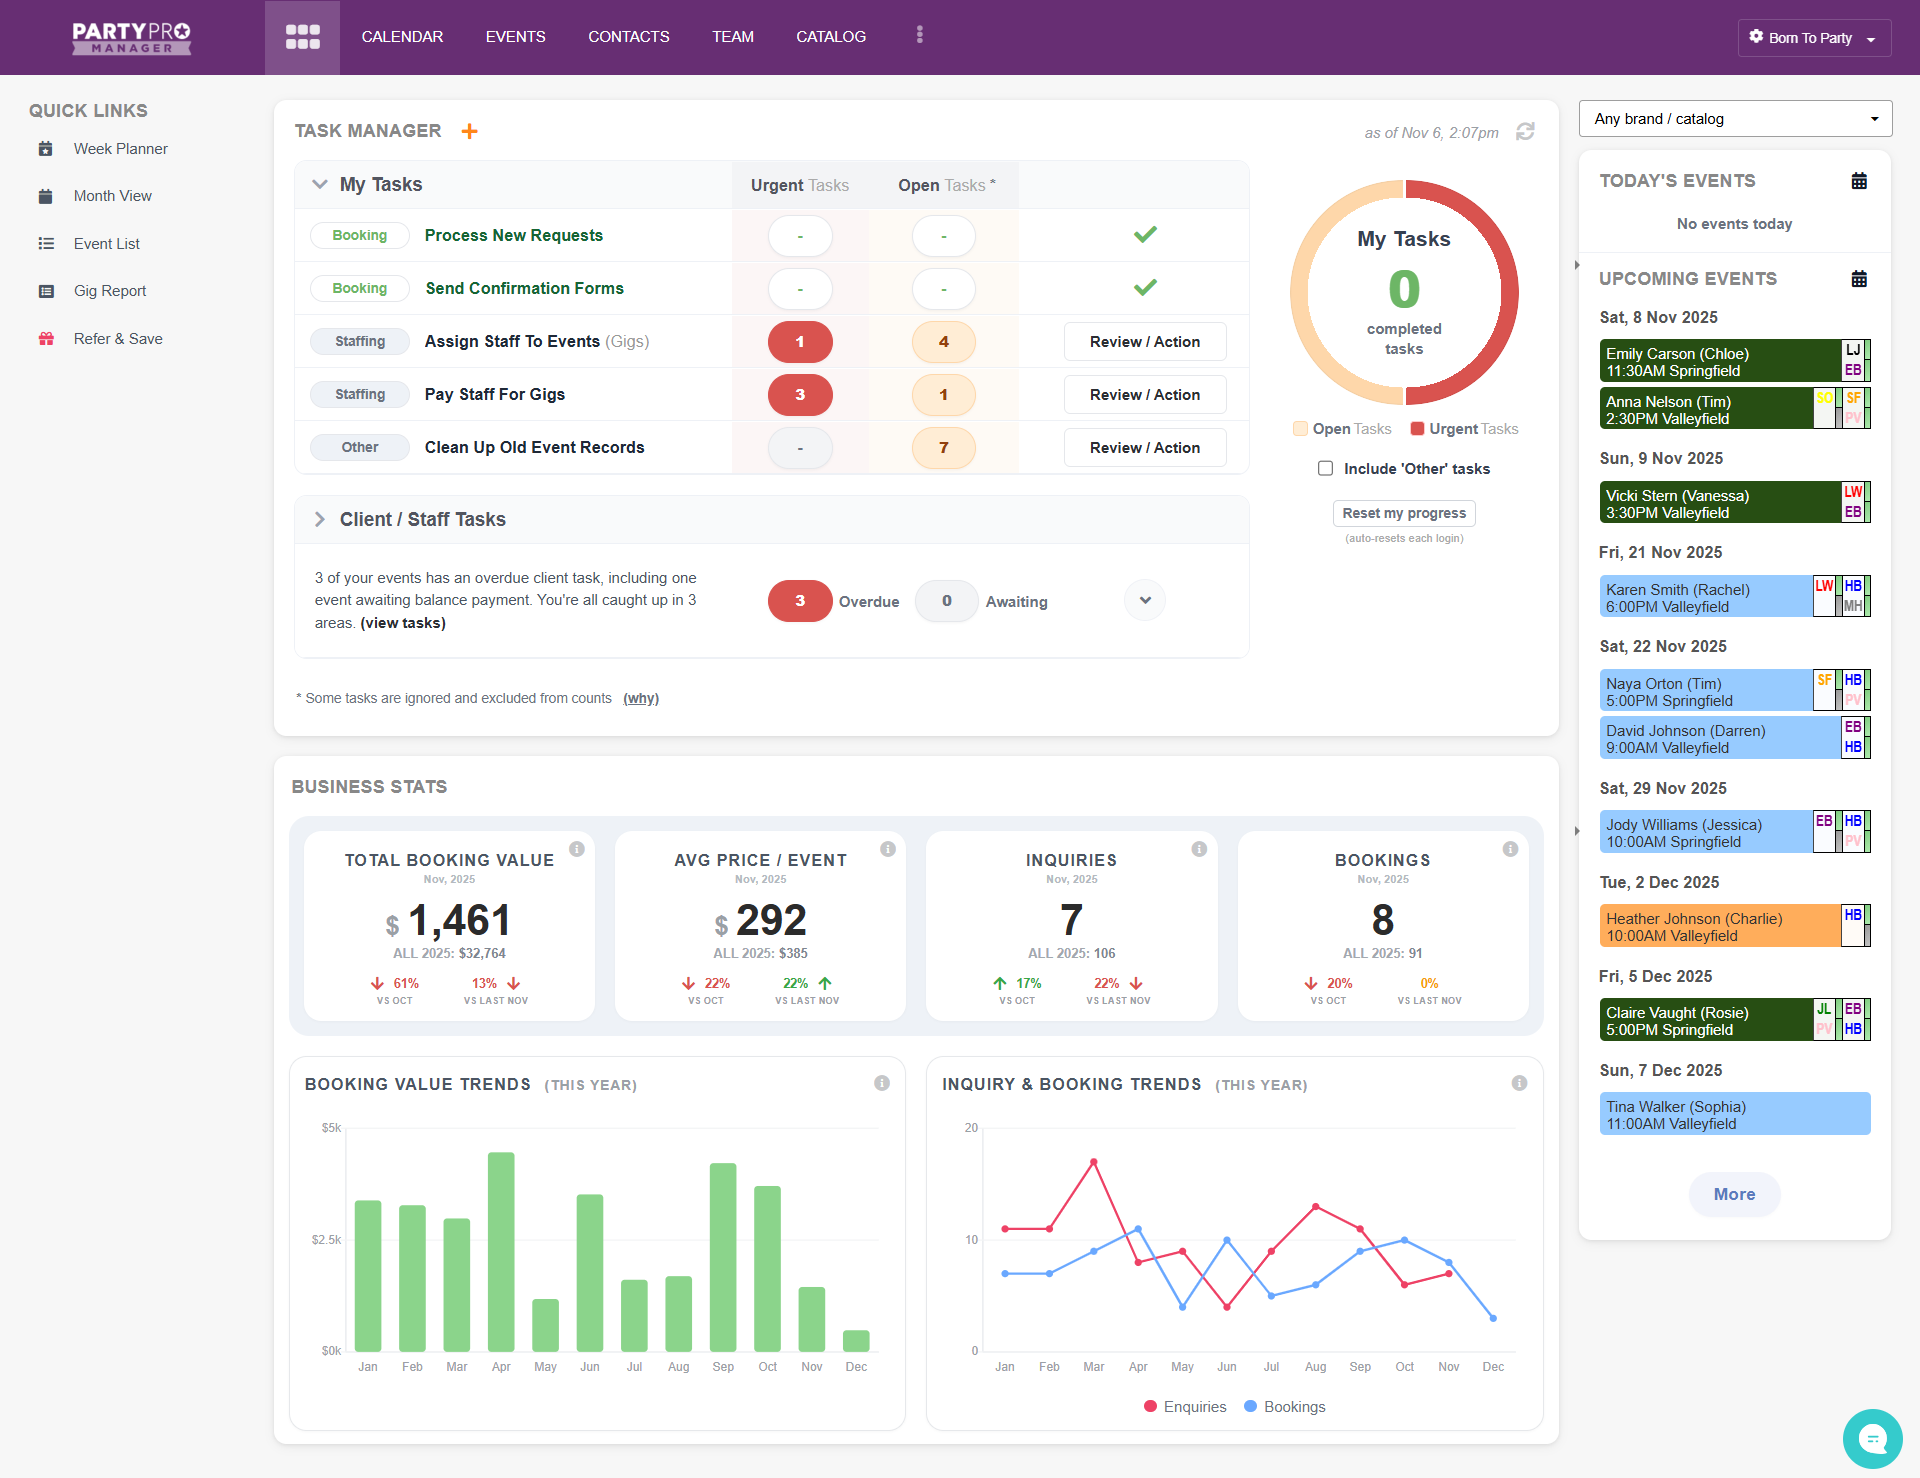
The Dashboard is divided into four main areas, as shown below.

1️⃣ Quick Links (left side)
Your shortcuts to frequently used and powerful tools such as Week Planner, Month View, Event List, and Gig Report.
2️⃣ Task Manager (main section, top)
Tracks important to-dos like sending confirmation forms, assigning staff, or processing new bookings. More details on this below.
3️⃣ Business Stats (main section, bottom)
Gives you live month-to-date performance data — your total booking value, average event price, inquiries, and bookings, plus trend charts for the year.
4️⃣ Events Sidebar (right side)
Shows Today’s Events and Upcoming Events at a glance. Hover to see details, double-click to open an event editor directly, or click More to open your full Calendar, Week Planner, or Event List.
Other notable things worth a quick mention:
Use the Brand/Catalog filter to view data for a specific brand and/or catalog (or “All” by default).
The small timestamp (e.g. “as of Nov 6, 2:07pm”) shows when stats were last refreshed. Click the refresh icon to update.
💡 Tip: You can return to the Dashboard anytime by clicking the new Dashboard icon in your top navigation bar.
![]()
✅ Task Manager Overview
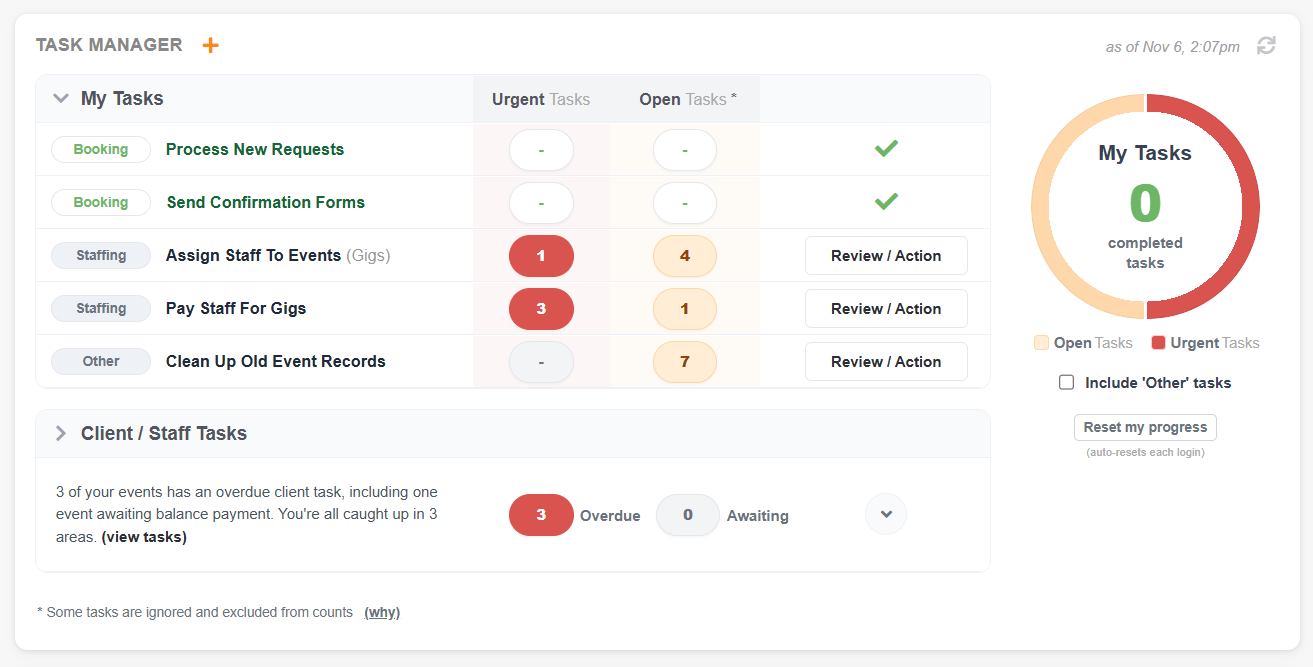
Your Task Manager keeps you organized by showing everything that needs attention — grouped into clear categories and separated by who needs to take action next.

Every task, whether under My Tasks or Client/Staff Tasks, follows the same format and behavior:
Your Task Manager keeps you organized by showing everything that needs your attention, labelled by category:
Categories:
Booking – New inquiries, confirmation forms, etc.
Staffing – Assigning and confirming staff.
Billing – Payment-related actions.
Other – General housekeeping tasks.
Urgent vs Open:
“Urgent” tasks are time-sensitive (definitions vary per category).
“Open” tasks are active but not yet critical.
When a category is "All caught up", these counts are replaced with a dash (–) and a checkmark replaces the “Review/Action”.
Review/Action Button:
Clicking Review/Action takes you directly to a filtered list of events that need attention for that category
These elements are consistent across both task lists, helping you quickly identify what needs focus, regardless of who’s responsible for completing it.
🧑💼 My Tasks
This section focuses on actions you or your team need to complete — the things directly within your control.
Examples include:
Sending confirmation forms to clients
Assigning or scheduling staff
Processing new booking requests
Your My Tasks progress chart on the right shows your completion progress for the current login session, updating in real time as you check items off.
Use Reset My Progress to clear today’s counter if you’d like to start fresh — it resets automatically each time you log in.
🟢 Note: The progress chart tracks only My Tasks, since it’s designed to measure the progress of actions you can directly complete yourself.
👥 Client/Staff Tasks
This section tracks actions that depend on others — typically your clients or team members.
For example:
Clients who still need to approve an event confirmation form
Staff who haven’t yet confirmed their assigned gigs
While these aren’t tasks you complete directly, they show where a gentle follow-up or reminder could help move things along.
Clicking anywhere on this section expands it to reveal a categorized breakdown, similar in layout to My Tasks, showing what’s outstanding for each group.
In short:
Your Task Manager brings all activity together in one view — showing what you can act on now and what might need a friendly nudge from someone else.
👇 Viewing and Managing Individual Tasks
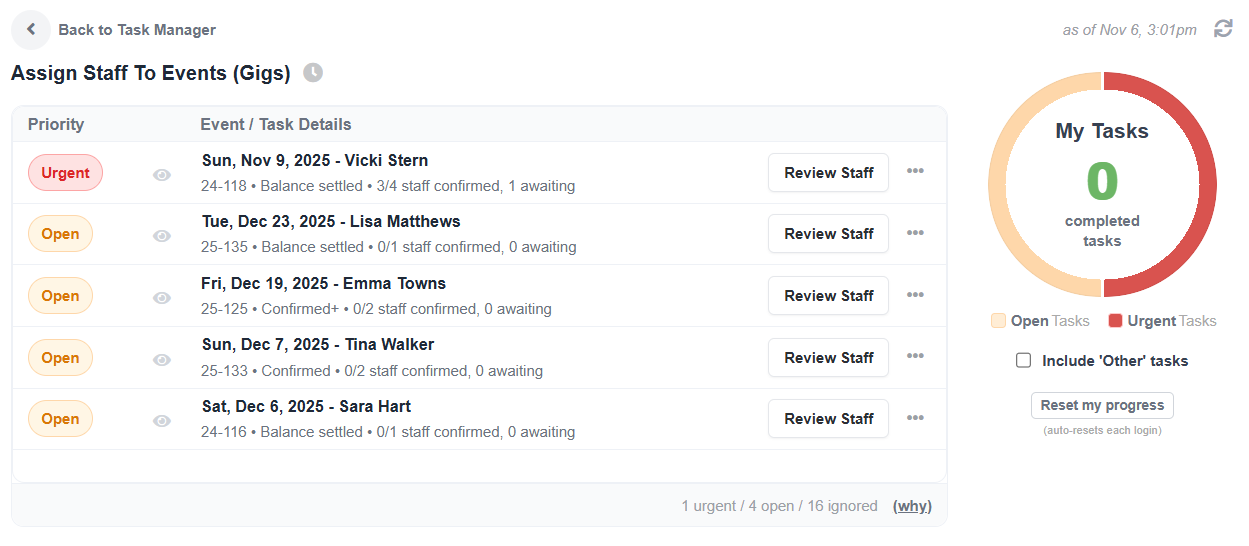
When you click into any task category (for example, Assign Staff To Events), you’ll see a detailed list of events needing action.

Here’s what you’ll see:
🟧 Helpful Info: At the top, next to the category title, you'll see a clock icon, hover over this icon for a quick explanation of how urgency is determined.
1️⃣ Priority Labels:
Each event is marked Urgent or Open based on the rules for that task type.
2️⃣ Quick View (eyeball icon):
Hover to preview an event summary without leaving the Dashboard.
3️⃣ Event Details:
Shows event date, client name, and quick indicators (e.g. “Balance settled • 3/4 staff confirmed”).
4️⃣ Primary Action Button:
The button (e.g. Review Staff, Review Payments) opens the most relevant page or section for completing that task.
5️⃣ More Actions (⋯):
Click to open shortcuts to specific areas of the Event Editor — such as a particular tab — or to clone the event.
6️⃣ Double-click the Row:
Opens the full Event Editor for that event, right from the Dashboard.
7️⃣ Live Updates:
When you complete an item, it disappears from the list, and your “Completed Tasks” count and progress chart update instantly.
🔍 Ignored Tasks:
At the bottom of each list, you’ll see totals like “1 urgent / 4 open / 16 ignored”. Tasks matching certain ignore rules (e.g. very old inquiries or past events) are excluded from totals for a clearer view of active work.
📊 Business Stats Overview

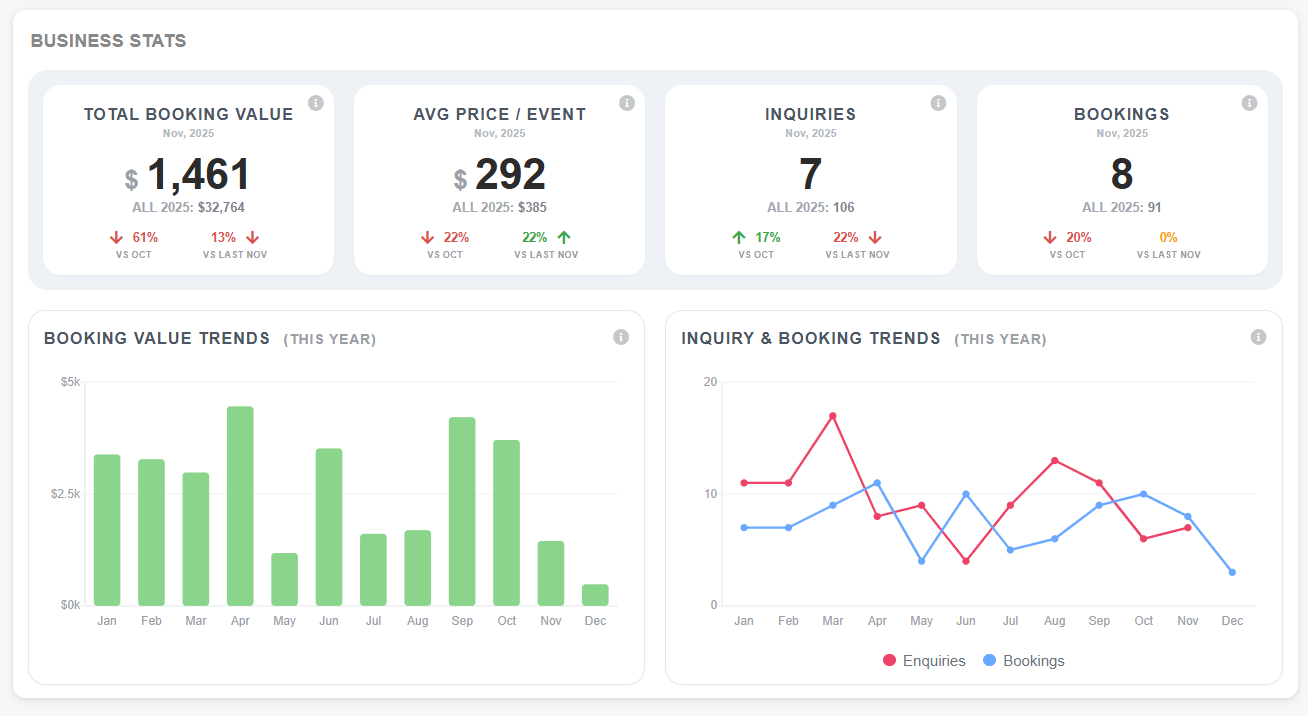
The Business Stats section gives a quick monthly snapshot of how your business is performing:
Total Booking Value – total dollar amount of confirmed bookings for the current month.
Avg Price / Event – the average value per confirmed booking.
Inquiries – the number of new inquiries received this month.
Bookings – the number of new bookings confirmed this month.
Each stat compares against:
The previous month (e.g. vs Oct), and
The same month last year (e.g. vs Last Nov).
Hover over the percentage to see the exact figures for those comparison periods.
Below, the two charts show:
Booking Value Trends (This Year) – a monthly breakdown of booking value.
Inquiry & Booking Trends (This Year) – monthly counts of inquiries (red line) vs bookings (blue line).
Tooltips appear when hovering over any data point for exact numbers.
💡 Quick Tips
Click the refresh icon anytime to reload the latest figures.
The Dashboard always opens showing the current month.
Hover over anything with an icon (ℹ️, 👁️, etc.) — nearly everything has helpful tooltips.
If you manage multiple brands, the Brand/Catalog filter ensures your stats and tasks reflect exactly what you want to see.
Your task completion chart resets each login, so you can start fresh every day.
✅ Summary
The new Dashboard brings your entire PPM workflow together — tasks, stats, and events — all in one powerful view.
You can now manage your day from a single screen, monitor performance, and jump directly into what needs attention with a single click.


